Orders and replenishment
Timestamped lines, quantities, priorities, release rules and cancellations.
Connect demand data, conveyor resources and control behavior so reviewers can see what a divert rate depends on, reproduce a run and carry accepted cases into FAT and SAT.
Every input receives an owner, extraction time, scope, unit and version. Missing or inconsistent fields remain visible in a quality log; they are not silently filled with favorable assumptions that inflate sorter capacity.
Demand data typically includes SKU velocity, order lines, release waves, replenishment and cutoff behavior. Physical data includes load dimensions, rated load in kg, conveyor geometry, divert pitch and buffer locations. Control data identifies WMS, WCS, WES, PLC and equipment interfaces.
Timestamped lines, quantities, priorities, release rules and cancellations.
Velocity class, unit geometry, orientation constraints and handling limits.
Travel, transfer, divert and service times with shift calendars.
Commands, acknowledgements, timeouts, retry behavior and recovery authority.
A result includes the environment, method, inputs and observed output—not only a utilization chart.
Warm-up, typical order mix, replenishment and expected resource availability establish the reference.
Cartons/hour or order lines/hour is observed with accumulation occupancy, queueing and station balance over the agreed duration.
A blocked destination, late PLC confirmation or unavailable divert bank tests containment and graceful degradation.
Time to stable flow, residual recirculation and manual intervention are measured after service returns.
Reproducible path: retain source files and model version → record random seeds or deterministic schedules → execute the run identifier → export event and KPI traces → compare observed behavior with the signed scenario definition.
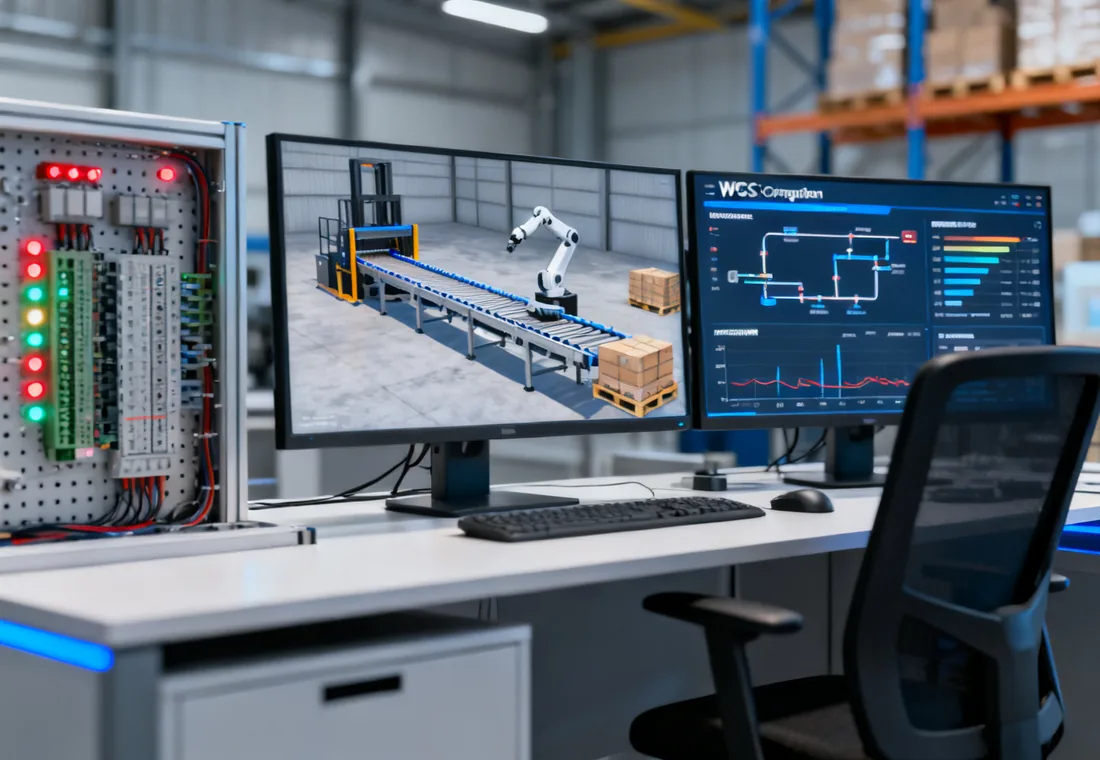
Virtual conveyor and sorter responses connect to PLC or software under test through the defined OPC UA, fieldbus or API boundary. Nominal sequences are paired with late confirmations, duplicates, lost messages, blocked transfers and controlled restart.
Emulation has limits: it cannot duplicate every sensor failure, network condition, mechanical tolerance or operator action. Those limitations are documented, and installed SAT cases target the remaining risk around divert accuracy and pallet-cell interlocks.
Evidence strength increases as the system moves from model to installed operation, while every earlier assumption stays linked.
| Context | Evidence available | What remains unproven | Exit record |
|---|---|---|---|
| Simulation | Material flow, queues, utilization and scenario KPIs. | Actual controls timing and field behavior. | Versioned run package. |
| Emulation | Interface states, cycle timing, alarms and restart sequences. | Mechanical tolerance and installed network behavior. | Signal and event trace. |
| FAT | Integrated software/equipment behavior under controlled conditions. | Site geometry, production load and live dependencies. | Signed test protocol. |
| SAT | Installed end-to-end flow with agreed loads and disturbances. | Performance outside stated conditions or observation period. | Acceptance and open-item register. |
Include sample orders, load units, resource calendars, interface states and the recovery behavior that matters to operations. Unknowns can remain flagged for controlled sensitivity tests.